 If it was your job to decide how money is spent on
local transportation projects and programs, what areas would be most important
for you to invest money in? SRTC is
launching an online survey tool that demonstrates the difficult financial
trade-offs that must be made to maintain and improve our transportation system.
New federal and state regulations require Metropolitan Planning
Organizations like SRTC to create and track performance measures and targets to
ensure the transportation system is developing as planned.
The new web tool
will help you understand how investments and outcomes are related and also
allows you to identify priorities of the region that will help develop those
targets.
will help you understand how investments and outcomes are related and also
allows you to identify priorities of the region that will help develop those
targets.
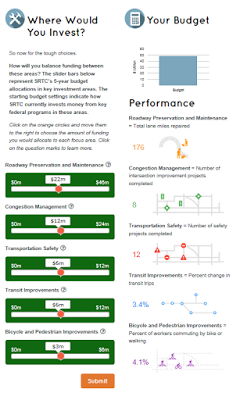
The tool allows users to choose an estimated level at which they would
like to fund categories such as roadway preservation and management, congestion
management, bicycle and pedestrian improvements, transit improvements and
transportation safety.
like to fund categories such as roadway preservation and management, congestion
management, bicycle and pedestrian improvements, transit improvements and
transportation safety.
As you
allocate money to each category, graphics show just how far that amount would
go. For instance, for roadway preservation, the amount of lane miles repaired
changes as you change the funding for that category. For bicycle and pedestrian
improvements, the percentage of people commuting by bike or walking increases
or decreases as you add or subtract money. Screen shots on the following page
give an idea what you will see when using the web tool.
Just like in
real life, the hard part is not blowing your budget. The $50 million available
for distribution on the web tool is based on the approximate amount of money
projected to be invested in the local transportation system by SRTC over the
next five years. Once you have made your
budgeting decisions, you can compare your results to others who have used the
web tool and learn about the next steps in the performance measurements
development process.
